update 2019: this is a repost on my own blog. original article can be read on medium.

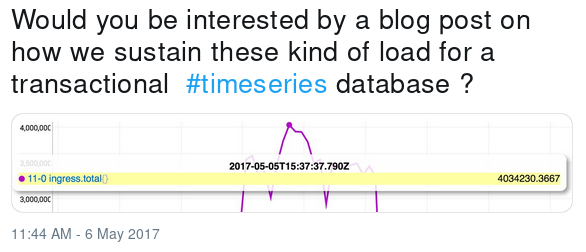
We, at Metrics Data Platform, are working everyday with Warp10 Platform, an open source Time Series database. You may not know it because it’s not as famous as Prometheus or InfluxDB but Warp10 is the most powerful and generic solution to store and analyze sensor data. It’s the core of Metrics, and many internal teams from OVH are using Metrics Data Platform to monitor their infrastructure. As a result, we are handling a pretty nice traffic 24/7/365, as you can see below:
Not only Warp10 allows us to reach an unbelievable scalability but it also comes with his own language called WarpScript, to manipulate and perform heavy time series analysis. Before digging into the need of a new language, let’s talk a bit about the need of time series analysis.### What is a time serie ?
A time serie, or sensor data, is simply a sequence of measurements over time. The definition is quite generic, because many things can be represented as a time serie:
- the evolution of the stock exchange or a bank account
- the number of calls on a webserver
- the fuel consumption of a car
- the time to insert a value into a database
- the time a customer is taking to register on your website
- the heart rate of a person measured through a smartwatch
From an historical point of view, time series appeared shortly after the creation of the Web, to help engineers monitor the networks. It quickly expands to also monitors servers. With the right monitoring system, you can have insights and KPIs about your service:
Analysis of long-term trend
- How fast is my database growing?
- At what speed my number of active user accounts grows?
The comparison over time
- My queries run faster with the new version of my library? Is my site slower than last week?
Alerts
- Trigger alerts based on advanced queries
Displaying data through dashboards
- Dashboards help answer basic questions on the service, and in particular the 4 indispensable metrics: latency, traffic, errors and service saturation
The possibility of designing retrospective
- Our latency is doubling, what’s going on?### Time series are complicated to handle
Storage, retrieval and analysis of time series cannot be done through standard relational databases. Generally, highly scalable databases are used to support volumetry. For example, the 300,000 Airbus A380 sensors on board can generate an average of 16 TB of data per flight. On a smaller scale, a single sensor that measures every second generates 31.5 million values per year. Handling time series at scale is difficult, because you’re running into advanced distributed systems issues, such as:
- ingestion scalability, i.e. how to absorb all the datapoints 24⁄7
- query scalability, i.e. how to query in a raisonnable amount of time
- delete capability, i.e. how to handle deletes without stopping ingestion and query
Frustration with existing open source monitoring tools like Nagios and Ganglia is why the giants created their own tools — Google has Borgmon and Facebook has Gorilla, just to name two. They are closed sources but the idea of treating time-series data as a data source for generating alerts is now accessible to everyone, thanks to the former Googlers who decided to rewrite Borgmon outside Google.### Why another time series database?
Now the time series ecosystem is bigger than ever, here’s a short list of what you can find to handle time series data:
- InfluxDB.
- Prometheus.
- Riak TS.
- OpenTSDB.
Then there’s Warp10. The difference is quite simple, Warp10 is a platform whereas all the time series listed above are stores. This is game changing, for multiples reasons.
🔗Security-first design
Security is mandatory for data access and sharing job’s results, but in most of the above databases, security access is not handled by default. With Warp10, security is handled with crypto tokens similar to Macaroons.
🔗High level analysis capabilities
Using classical time series database, high level analysis must be done elsewhere, with R, Spark, Flink, Python, or whatever languages or frameworks that you want to use. Using Warp10, you can just submit your script and voilà!
🔗Server-side calculation
Algorithms are resource heavy. Whatever they’re using CPU, ram, disk and network, you’ll hit limitations on your personal computer. Can you really aggregate and analyze one year of data from thousands of sensors on your laptop? Maybe, but what if you’re submitting the job from a mobile? To be scalable, analysis must be done server-side.### Meet WarpScript

Warp10 folks created WarpScript, an extensible stack oriented programming language which offers more than 800 functions and several high level frameworks to ease and speed your data analysis. Simply create scripts containing your data analysis code and submit them to the platform, they will execute close to where the data resides and you will get the result of that analysis as a JSON object that you can integrate into your application.
Yes, you’ll be able to run that awesome query that is fetching millions of datapoints and only get the result. You need all the data, or just the timestamp of a weird datapoint? The result of the script is simply what’s left on the stack.
🔗Dataflow language
WarpScript is really easy to code, because of the stack design. You’ll be pushing elements into the stack and consume them. Coding became logical. First you need to fetch your points, then applying some downsampling and then aggregate. These 3 steps are translated into 3 lines of WarpScript:
- FETCH will push the needed Geo Time Series into the stack
- BUCKETIZE will take the Geo Time Series from the stack, apply some downsampling, and push the result into the stack
- REDUCE will take the Geo Time Series from the stack, aggregate them, and push them back into the stack
Debugguing as never be that easy, just use the keyword STOP to see the stack at any moment.
🔗Rich programming capabilities
WarpScript is coming with more than 800 functions, ready to use. Things like Patterns and outliers detections, rolling average, FFT, IDWT are built-in.
🔗Geo-Fencing capabilities
Both space (location) and time are considered first class citizens. Complex searches like “find all the sensors active during last Monday in the perimeter delimited by this geo-fencing polygon” can be done without involving expensive joins between separate time series for the same source.
🔗Unified Language
WarpScript can be used in batch mode, or in real-time, because you need both of them in the real world.
🔗Geez, give me an example
Here’s an example of a simple but advanced query:
// Fetching all values
[ $token ‘temperature’ {} NOW 1 h ] FETCH // Get max value for each minute
[ SWAP bucketizer.max 0 1 m 0 ] BUCKETIZE // Round to nearest long
[ SWAP mapper.round 0 0 0 ] MAP // reduce the data by keeping the max, grouping by 'buildingID'
[ SWAP [ 'buildingID' ] reducer.max ] REDUCE
Have you guessed the goal? The result will display the temperature from now to 1 hour of the hottest room per buildingID.
🔗What about a more complex example?
You’re still here? Good, let’s have a more complex example. Let’s say that I want to do some patterns recognition. Let’s take an example. Here’s a cosinus with an increasing amplitude:
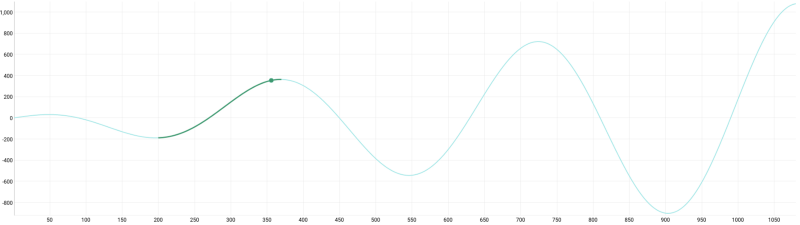
I want to detect the green part of the time series, because I know that my service is crashing when I have that kind of load. With WarpScript, it’s only a 2 functions calls:
- PATTERNS is generating a list of motifs.
- PATTERNDETECTION is running the list of motifs on all the time series you have.
Here’s the code
// defining some variables
32 'windowSize' STORE
8 'patternLength' STORE
16 'quantizationScale' STORE

// Generate patterns
$pattern.to.detect 0 GET
$windowSize $patternLength $quantizationScale PATTERNS
VALUES 'patterns' STORE

// Running the patterns through a list of GTS (Geo Time Series)
$list.of.gts $patterns
$windowSize $patternLength $quantizationScale  PATTERNDETECTION
Here’s the result:
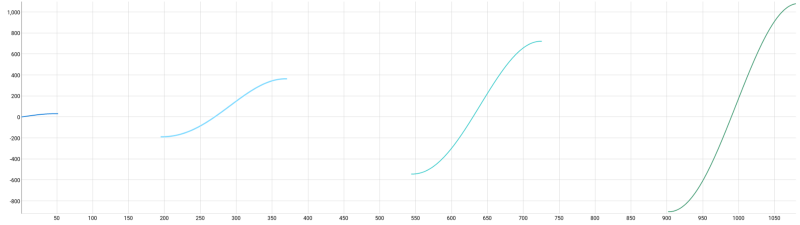
As you can see, PATTERNDETECTION is working even with the increasing amplitude! You can discover this example by yourself by using Quantum, the official web-based IDE for WarpScript. You need to switch X-axis scale to Timestamp in order to see the courbe.Thanks for reading, here’s a nice list of additionnals informations about the time series subject and Warp10:
- Metrics Data Platform, our product
- Warp10 official documentation
- Warp10 tour, similar to “The Go Tour”
- Presentation of the Warp 10 Time Series Platform at the 42 US school in Fremont
- Warp10 Google Groups